
Unified, automated production and engineering reporting across the operation — shift, daily and rolling reports generated automatically, target vs actual vs variance in real time, from executive summary down to individual circuit.
Data exists across historians, SCADA, ERP and lab systems — yet decisions are still made on lagging, inconsistent, human-processed information.
Shift logs → Excel sheets → consolidation → validation → charts. Hours of engineering time are spent compiling reports before a single decision is made.
No reconciliation between historian, ERP and lab. Different numbers across every team; every meeting starts with a data dispute.
Downtime and losses are inconsistently captured and rarely attributed correctly — throughput loss, recovery variability, poor accountability, slow decisions.
“Every day, your best engineers are doing work a system should do. The data already exists — it's just not connected, not trusted, and not automated.”The reporting reality on most plants
When data is live and trusted, the conversation shifts from what happened to what we're doing about it.
Shift, daily, MTD and rolling reports generated automatically — zero manual compilation, consistent format, every time.
Real-time performance visibility against plan with instant deviation alerting — act within the shift, not the week.
Mining, processing and plant data unified in a single operational model — the disputes end because the numbers agree.
Drill from executive summary down to individual circuit or equipment performance in the same trusted environment.
Accountability at every level of the operation, with losses captured and classified at source.
Engineers move from report-building to optimisation and root-cause analysis — cross-functional teams align on shared visibility.
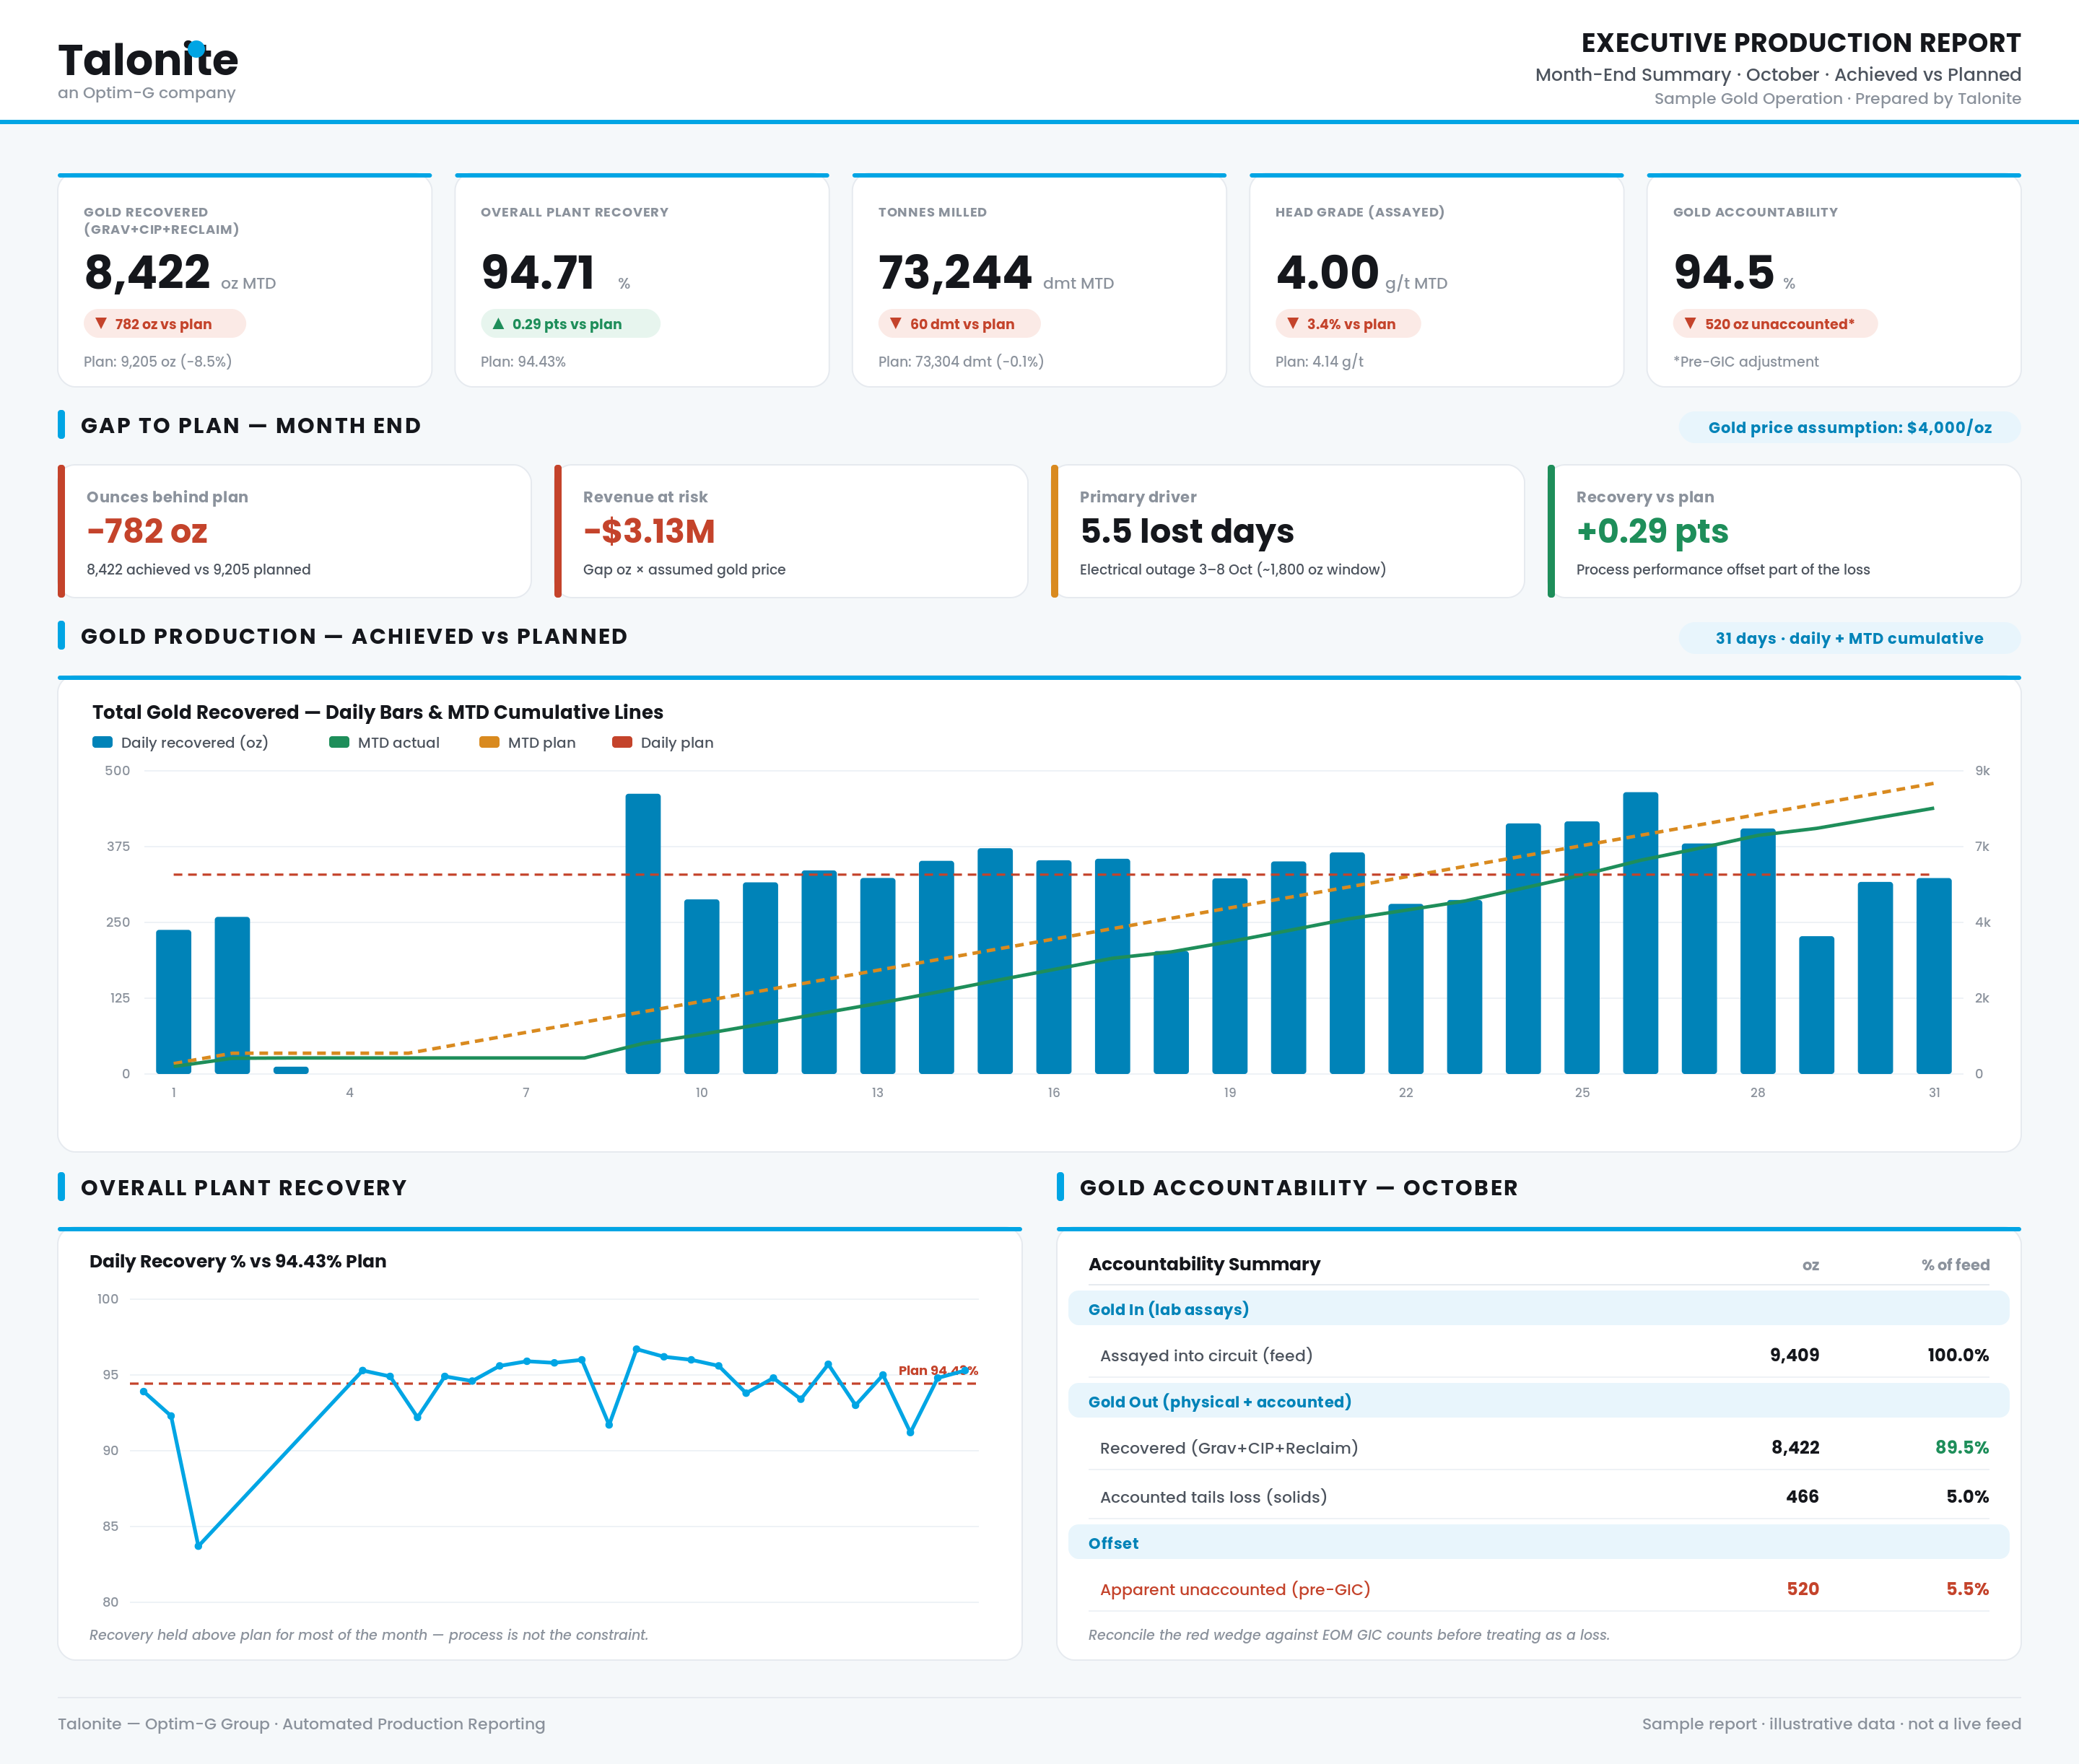
Illustrative, anonymised reports generated by Talonite from real plant data. From a month-end executive view down to shift-level tactical detail — automatically, in a consistent format, every time.

Real impact delivered on operating plants — recovered through faster variance response, accurate downtime capture and consistent KPI tracking.
Benchmark basis: results delivered across Talonite Smart Plant reporting implementations, measured against pre-implementation operational baselines.
Delivered through the Talonite Three Horizons journey — Foundation → Optimise → Improve — with ROI tracked, validated and compounded through our Smart Eye value layer. Every solution, every discipline.
See how we deliver value →Faster decisions. Consistent visibility. Elimination of data disputes. Plant-wide accountability — starting with the next shift. Immediate variance detection lets teams act within the shift; accurate attribution creates accountability at every level; and APC effectiveness improves because the plant runs on shared, stable visibility.
Typical operations spend 4–8 hours per day manually compiling shift and daily reports. Automated reporting eliminates that compilation work and delivers one version of the truth, on time, every shift.
Every report compares actual production against plan in real time and flags variances as they emerge — so teams manage exceptions during the shift instead of discovering them in tomorrow's meeting.
Beyond the recovered engineering hours, operations gain shared visibility that supports faster decisions — contributing to throughput improvements of 5–15% when combined with the underlying data and control layers.
We connect your historians, SCADA, ERP and lab systems into one automated reporting model — and prove the value against your own baseline.